\(\newcommand{L}[1]{\| #1 \|}\newcommand{VL}[1]{\L{ \vec{#1} }}\newcommand{R}[1]{\operatorname{Re}\,(#1)}\newcommand{I}[1]{\operatorname{Im}\, (#1)}\)
Cameraman solution
>>> #- Our usual imports
>>> import numpy as np  # the Python array package
>>> import matplotlib.pyplot as plt  # the Python plotting package
Download the file camera.txt and save it in your working
directory. It contains the pixel values for a picture, and it’s your job to
find what picture that is. The file contains a single floating point value per
line. Here are the first four lines of the file:
0.6118
0.6118
0.6196
0.6275
You will first need to read in the file as a list of floating point values. You probably want to start with something like this:
pixel_values = [] # empty list
>>> #- Read lines from file and convert to list of floats
>>> pixel_values = []
>>> fobj = open('camera.txt', 'r')
>>> for line in fobj:
...     pixel_values.append(float(line))
How many pixel values does this image contain? (Call this number P).
The array that forms the image is two-dimensional (it has a number of rows
M and a number of columns N). If we got the right number of pixel
values then M * N == P. That is, M and N have to be factors of
P (the number of pixel values).
We don’t know what M and N are, we will have to guess. Given the
number of pixel values, what would your guess be for M and N?
>>> #- Guess M, N
>>> P = len(pixel_values)
>>> M = np.sqrt(P)
>>> N = M
>>> M, N
(512.0, 512.0)
Next we want to convert the list of pixel values to an array (that forms the image).
Convert the pixel_values list to a pixel values array, and reshape it to
your guess for the shape (M, N).
>>> #- Convert list to array and reshape
>>> pixel_array = np.array(pixel_values)
>>> # The shape values shoule be integers
>>> pixel_array = np.reshape(pixel_array, (int(M), int(N)))
>>> pixel_array.shape
(512, 512)
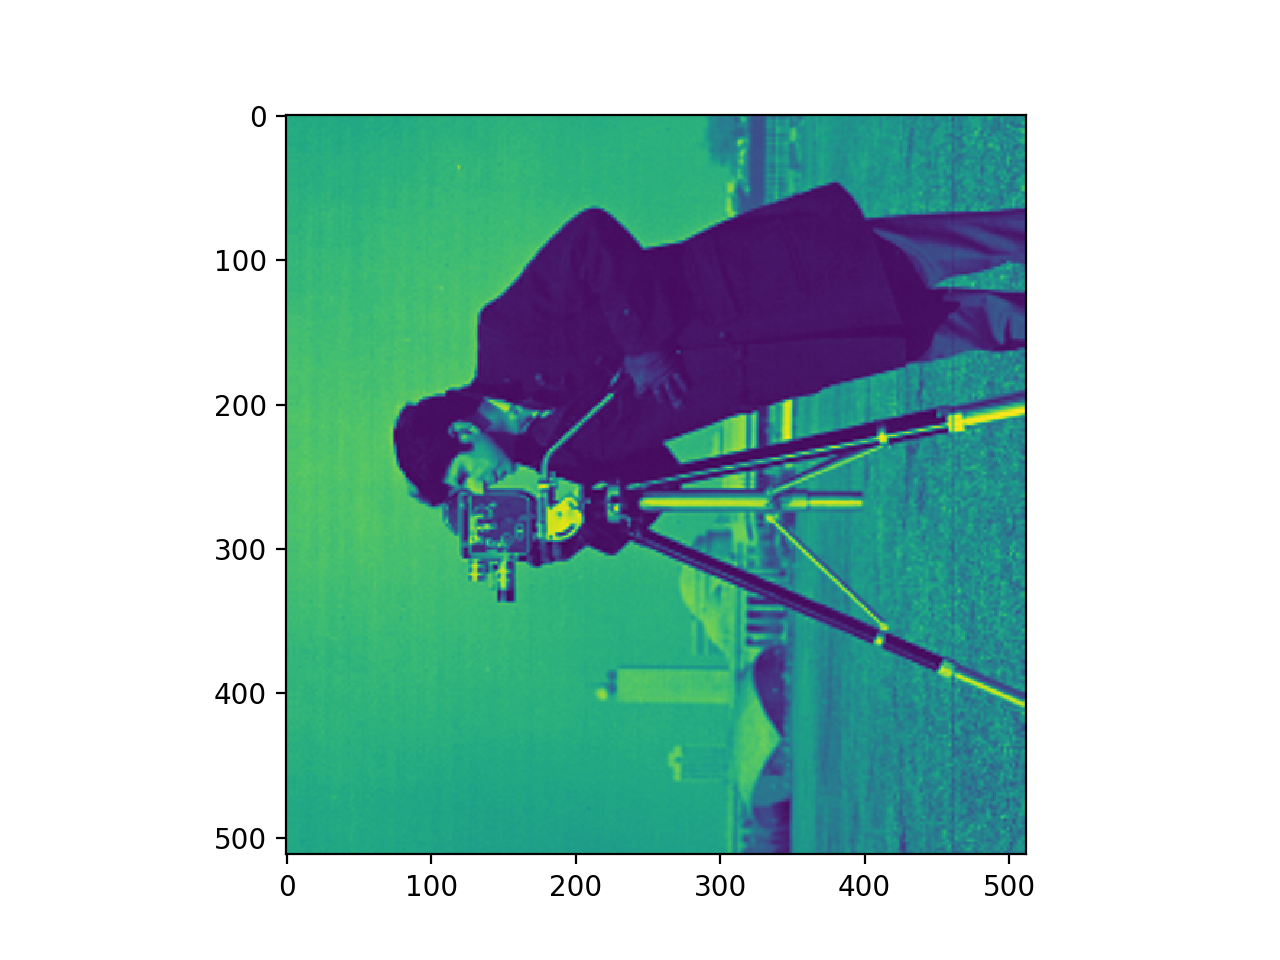
Show this as an image using matplotlib’s plt module:
>>> #- Show image using plt module
>>> plt.imshow(pixel_array)
<...>
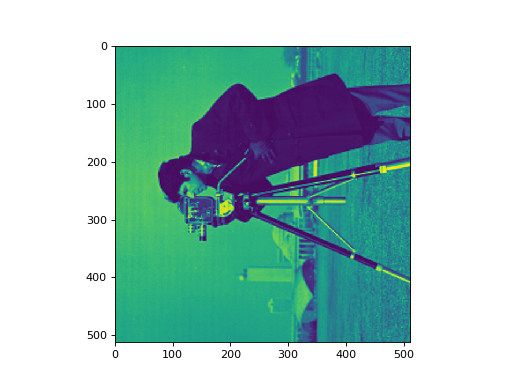
Is this the right shape already?
What do we need to do to make it look right on the plot?
Hint – the default colormap (cmap) in matplotlib version < 2.0 is
called jet.
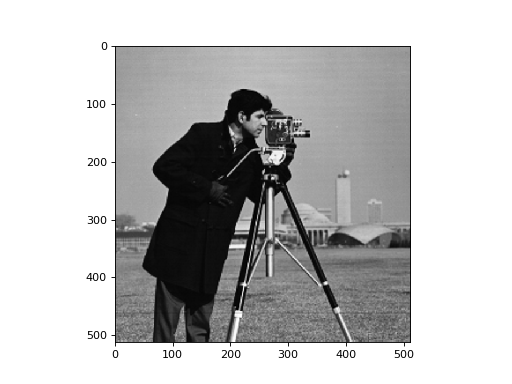
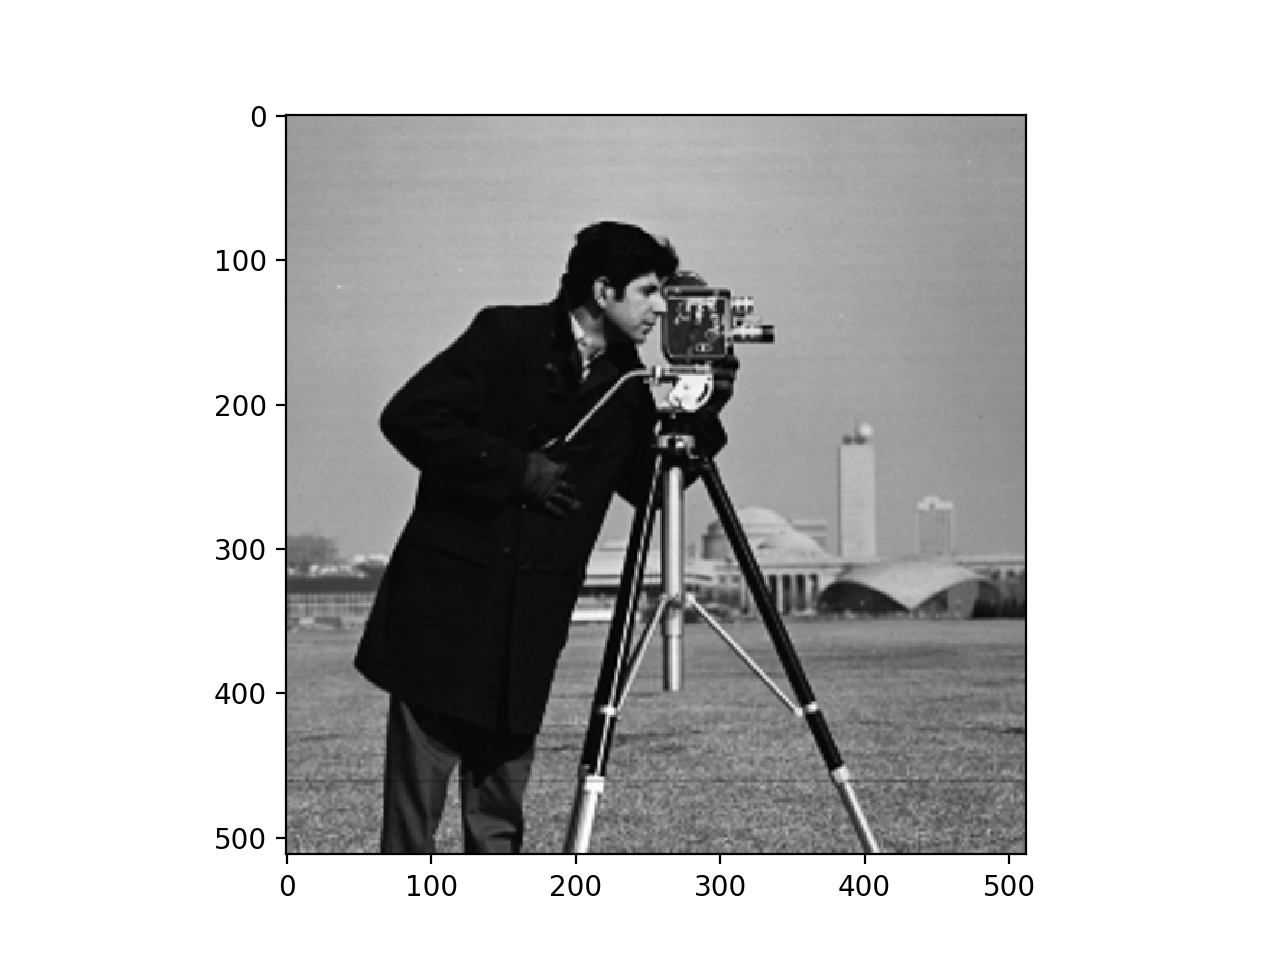
>>> #- A nicer version of the original plot
>>> plt.imshow(pixel_array.T, cmap='gray')
<...>

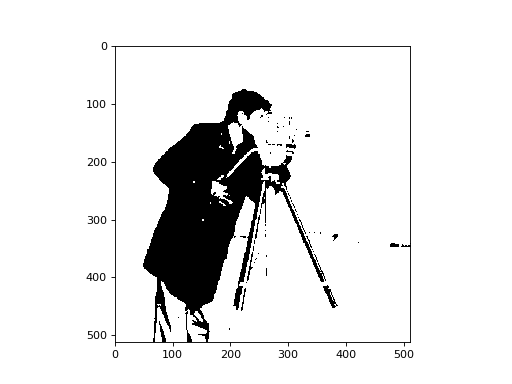
Now let’s say we want to binarize this image at some threshold T, so the
man’s coat and hair and the camera tripod are black (pixel value of 0) and
most everything else is white (pixel value of 1). How would we choose a good
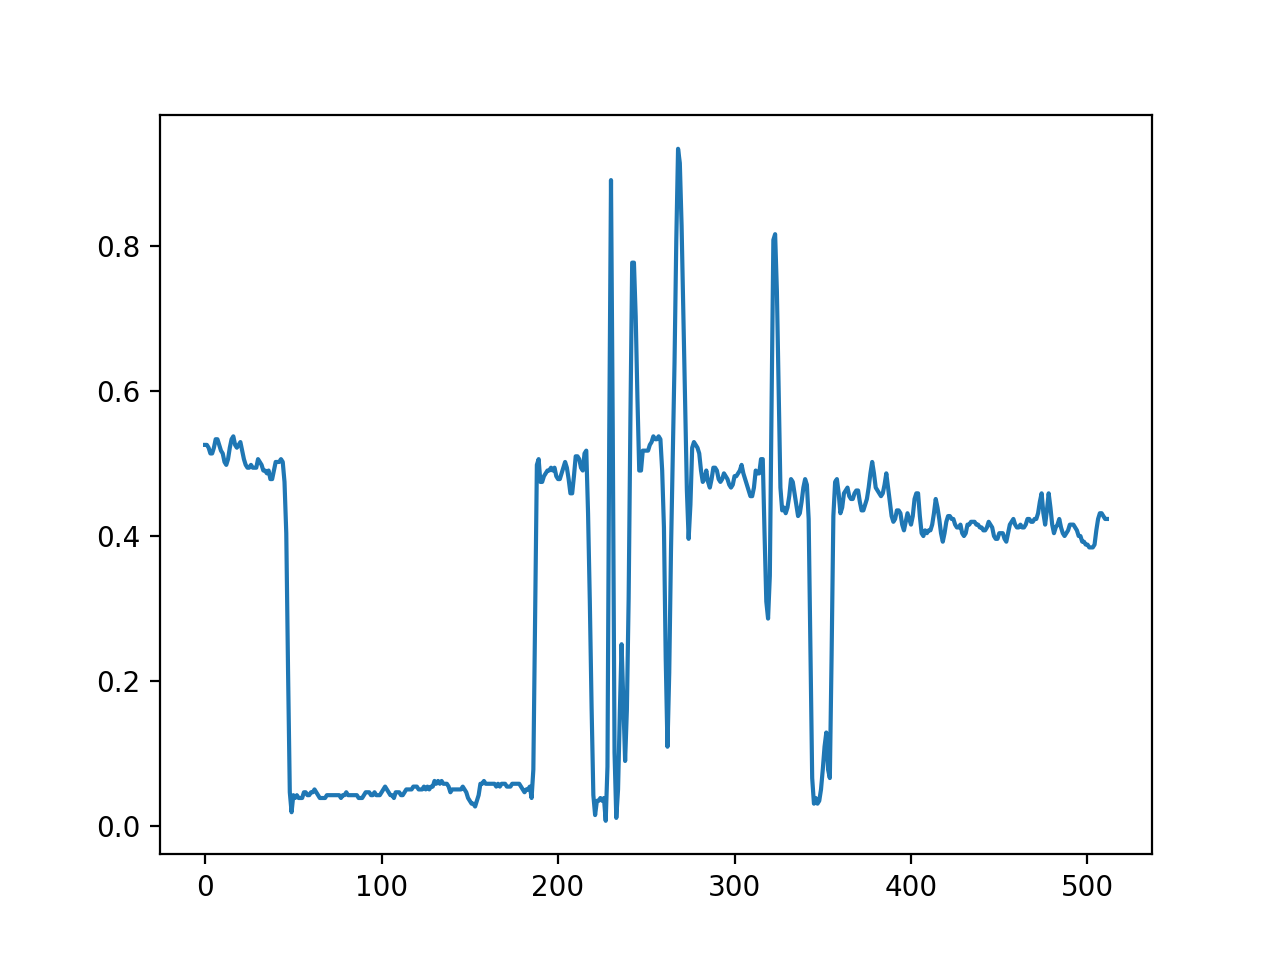
threshold? One step might be to plot a line out of the array (image) to get an
idea of the values on that line.
>>> #- A plot of the pixel position in x and the pixel value in y, for an image line.
>>> plt.plot(pixel_array.T[380])
[...]

Now you need to apply your threshold to the image to make a binary image where values less than the threshold are == 0 and greater than the threshold are == 1. You might want to play with the threshold a little to get a good result.
>>> #- Apply threshold to make new binary image, and show binary image
>>> binary_array = pixel_array > 0.1
>>> plt.imshow(binary_array.T, cmap='gray')
<...>
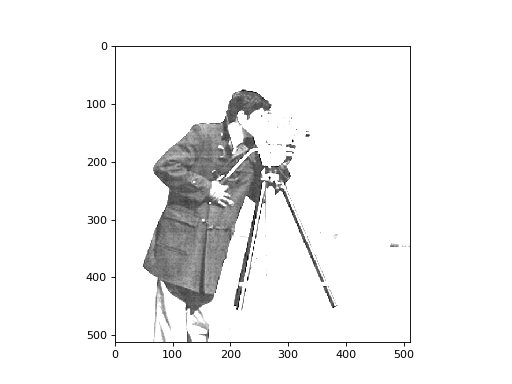
For extra points - the camera guy has a pocket on side of his coat, that
you can’t see well at the moment, because the range of values is too
large to distinguish the different dark levels on his coat. Can you make a
good picture to show the pocket? Hint: you might want to explore the
np.clip function.
>>> #- Extra points - a good image of the man's pocket.
>>> clipped_array = np.clip(pixel_array, 0, 0.1)
>>> plt.imshow(clipped_array.T, cmap='gray')
<...>
