\(\newcommand{L}[1]{\| #1 \|}\newcommand{VL}[1]{\L{ \vec{#1} }}\newcommand{R}[1]{\operatorname{Re}\,(#1)}\newcommand{I}[1]{\operatorname{Im}\, (#1)}\)
Plotting lines in matplotlib
>>> import matplotlib.pyplot as plt
To plot a line in matplotlib, use plot with the X coordinates as the first
argument and the matching Y coordinates as the second argument:
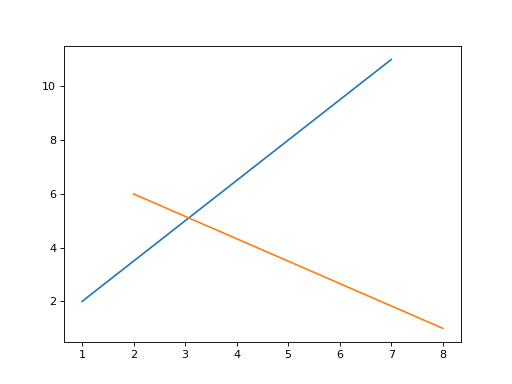
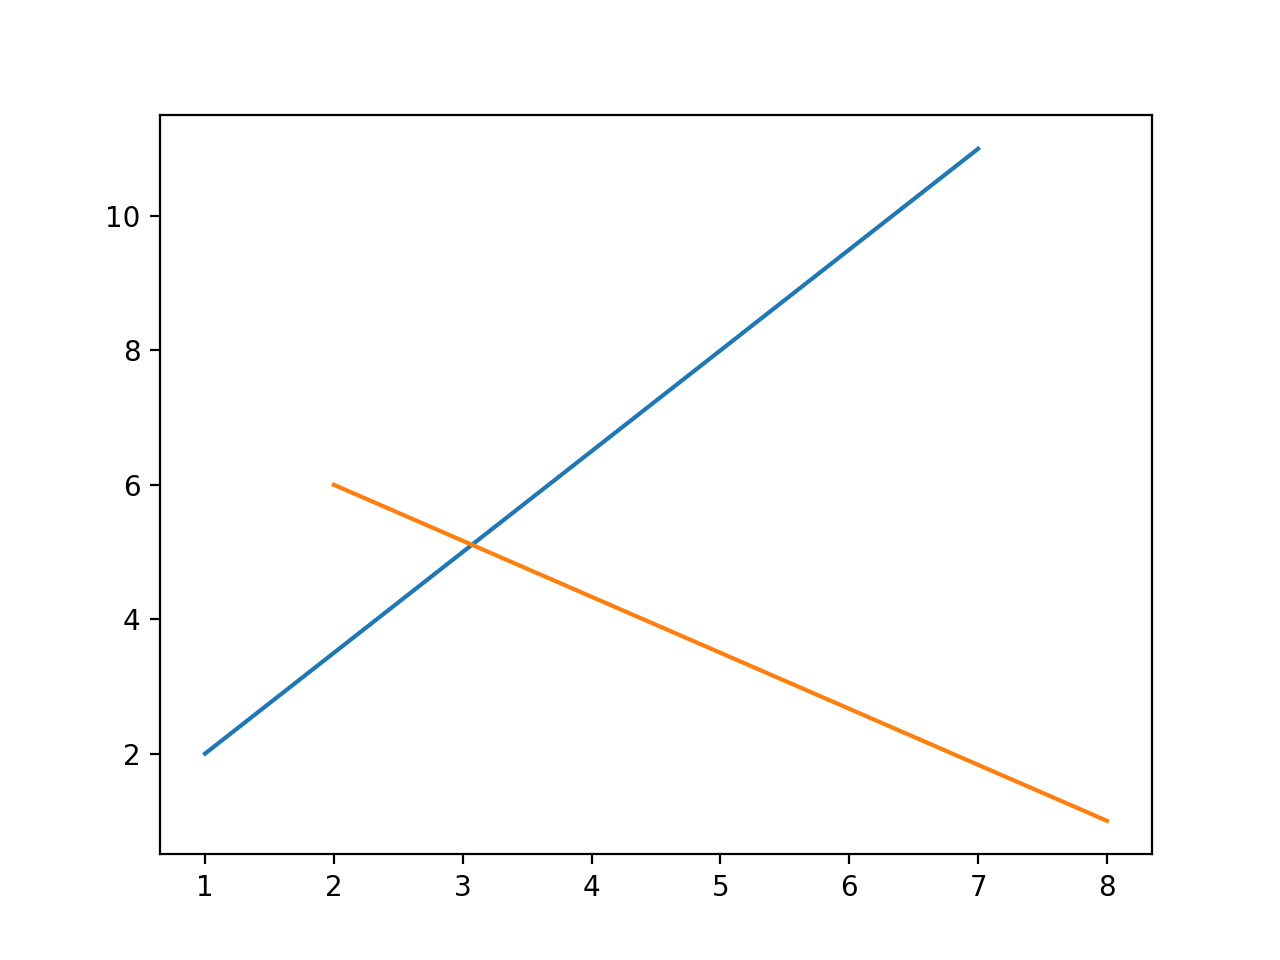
>>> # A line from (1, 2) to (7, 11)
>>> plt.plot([1, 7], [2, 11])
[...]
>>> # Another line from (2, 6) to (8, 1)
>>> plt.plot([2, 8], [6, 1])
[...]
