\(\newcommand{L}[1]{\| #1 \|}\newcommand{VL}[1]{\L{ \vec{#1} }}\newcommand{R}[1]{\operatorname{Re}\,(#1)}\newcommand{I}[1]{\operatorname{Im}\, (#1)}\)
Reslicing with affines exercise
>>> #: standard imports
>>> import numpy as np
>>> import numpy.linalg as npl
>>> import matplotlib.pyplot as plt
>>> # print arrays to 4 decimal places
>>> np.set_printoptions(precision=4, suppress=True)
>>> import nibabel as nib
>>> #: gray colormap and nearest neighbor interpolation by default
>>> plt.rcParams['image.cmap'] = 'gray'
>>> plt.rcParams['image.interpolation'] = 'nearest'
Reslicing between spaces using affines
Here are a BOLD (4D image) and a structural image for the same subject:
- BOLD (functional) image :
ds114_sub009_t2r1.nii; - structural image :
ds114_sub009_highres.nii.
They have different orientations and voxel sizes.
Confirm this by loading each image, and showing the:
- image shape;
- image affine from the header.
>>> #- Load structural and BOLD image
>>> #- Print image data shape
>>> #- Print affine from header
>>> bold_img = nib.load('ds114_sub009_t2r1.nii')
>>> print(bold_img.shape)
(64, 64, 30, 173)
>>> print(bold_img.affine)
[[  -4.        0.        0.      124.244 ]
 [   0.        3.9345    0.7207 -103.4497]
 [   0.       -0.7207    3.9346  -33.4929]
 [   0.        0.        0.        1.    ]]
>>> structural_img = nib.load('ds114_sub009_highres.nii')
>>> print(structural_img.shape)
(256, 156, 256)
>>> print(structural_img.affine)
[[   0.9989   -0.0605    0.0109 -129.8257]
 [   0.0427    1.263     0.2336 -119.0906]
 [  -0.0215   -0.3028    0.9723 -143.4178]
 [   0.        0.        0.        1.    ]]
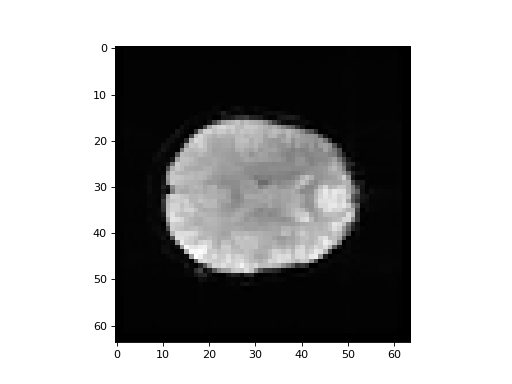
We know this BOLD image now. It has a bad first volume. Load the BOLD data, drop the first volume, and make a new volume that is the mean of the rest of the BOLD volumes across time. Plot an example slice from the mean volume.
>>> #- Load BOLD image data.  Drop first volume.  Make mean volume
>>> #- Plot an example slice from the mean volume
>>> bold_data = bold_img.get_data()
>>> mean_vol = bold_data[..., 1:].mean(axis=-1)
>>> plt.imshow(mean_vol[:, :, 14])
<...>

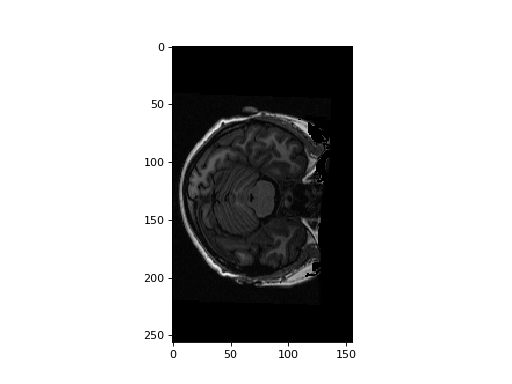
Load the structural data, plot an example slice:
>>> #- Load structural data, plot example slice
>>> structural_data = structural_img.get_data()
>>> plt.imshow(structural_data[:, :, 127])
<...>

Now we are going to reslice the anatomical to match the mean functional volume.
Remember pull resampling? We are going to need the transform that maps a coordinate in the mean functional volume, to the corresponding coordinate in the structural volume.
In order to do this, we need:
- the affine mapping from mean functional voxel coordinates to mm space
(
mean_vox2mm); - the affine mapping from mm space to structural voxel coordinates
(
mm2struct_vox).
We combine these by matrix multiplication (from right to left!) to give
mean_vox2struct_vox:
>>> #- Get `mean_vox2mm` mapping
>>> #- Get `mm2struct_vox` mapping
>>> #- Calculate `mean_vox2struct_vox`
>>> mean_vox2mm = bold_img.affine
>>> mm2struct_vox = npl.inv(structural_img.affine)
>>> mean_vox2struct_vox = mm2struct_vox.dot(mean_vox2mm)
>>> mean_vox2struct_vox
array([[  -3.9954,    0.1836,   -0.0536,  252.0885],
       [   0.1432,    3.0686,   -0.1663,  -17.1005],
       [  -0.0436,    0.2185,    3.9938,  113.2972],
       [   0.    ,    0.    ,    0.    ,    1.    ]])
Split this affine matrix up into its component 3 x 3 M matrix and the 3
element translation vector:
>>> #- Split `mean_vox2struct_vox` into 3x3 transformation, 3 element
>>> #- translation.
>>> M = mean_vox2struct_vox[:3, :3]
>>> M
array([[-3.9954,  0.1836, -0.0536],
       [ 0.1432,  3.0686, -0.1663],
       [-0.0436,  0.2185,  3.9938]])
>>> T = mean_vox2struct_vox[:3, 3]
>>> T
array([ 252.0885,  -17.1005,  113.2972])
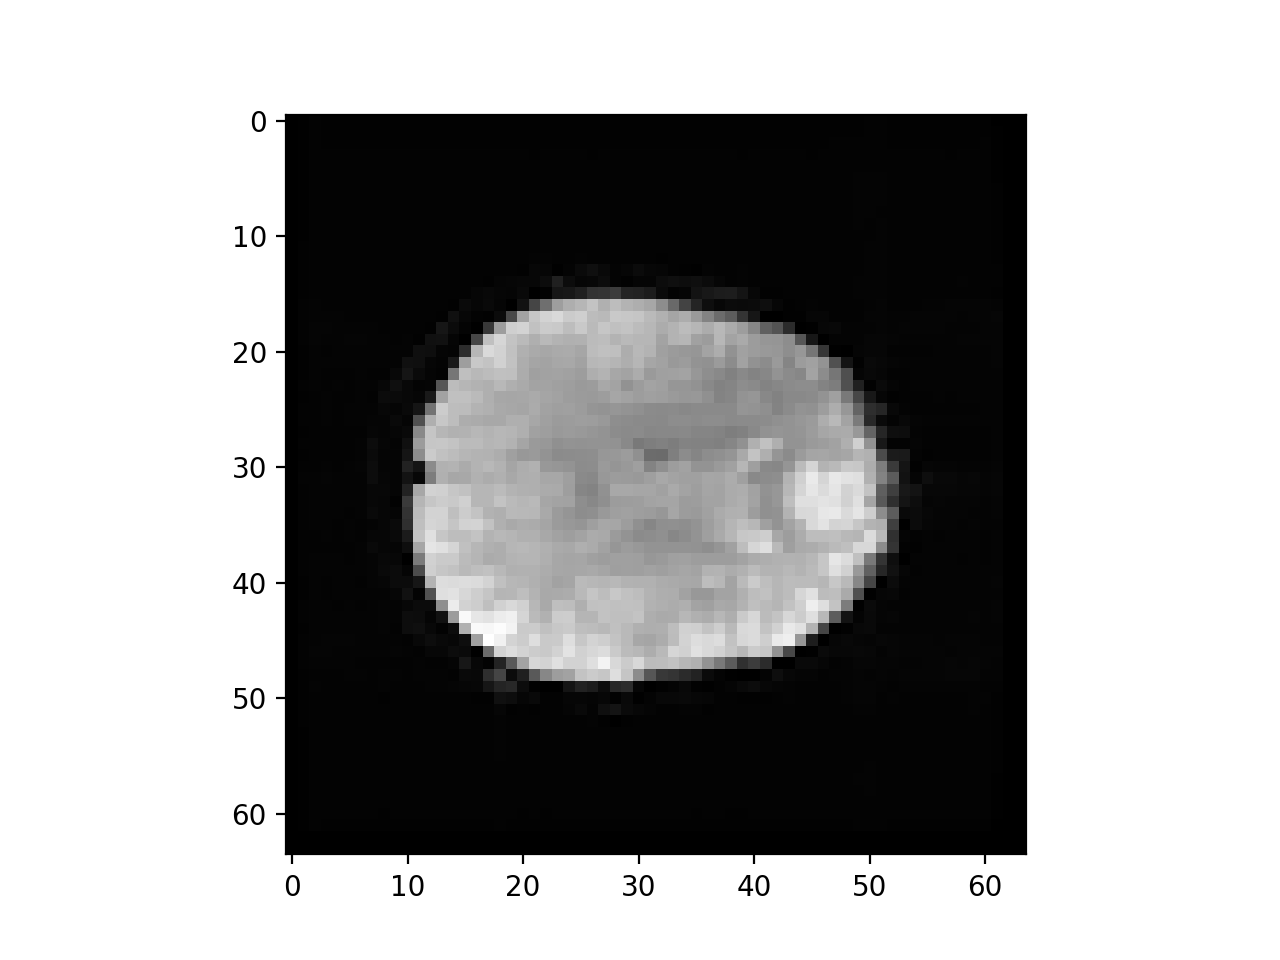
Now we can use affine_transform to make a new copy of the structural
image, resampled into the voxel coordinates of the mean functional image:
>>> #: import affine_transform function
>>> from scipy.ndimage import affine_transform
>>> #- Use affine_transform and the tranformation components to resample
>>> #- structural to functional
>>> struct_in_mean_space = affine_transform(structural_data, M, T, mean_vol.shape, order=1)
>>> struct_in_mean_space.shape
(64, 64, 30)
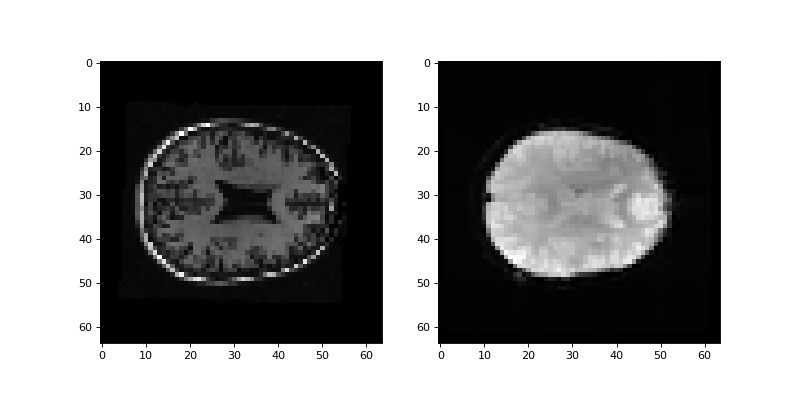
Use Subplots and axes in matplotlib to display and example slice from the mean image and the resliced structural side by side:
>>> #- Display example slice from mean vol and resliced structural side by
>>> #- side.
>>> fig, axes = plt.subplots(1, 2, figsize=(10, 5))
>>> axes[0].imshow(struct_in_mean_space[:, :, 14])
<...>
>>> axes[1].imshow(mean_vol[:, :, 14])
<...>
Now let’s go in the opposite direction.
We are going to resample the mean functional volume into the voxel space of the structural volume.
We need the affine transformation from voxel coordinates in the structural to
voxel coordinates in the mean functional volume – call this
struct_vox2mean_vox:
>>> #- Get affine transformation `struct_vox2mean_vox`
>>> struct_vox2mean_vox = npl.inv(mean_vox2struct_vox)
>>> struct_vox2mean_vox
array([[ -0.2497,   0.0151,  -0.0027,  63.5174],
       [  0.0115,   0.3242,   0.0137,   1.1053],
       [ -0.0034,  -0.0176,   0.2496, -27.7359],
       [  0.    ,   0.    ,   0.    ,   1.    ]])
Use the contents of struct_vox2mean_vox to reslice the mean functional to
the structural voxel space:
>>> #- Reslice mean functional to structural voxel space
>>> M, T = nib.affines.to_matvec(struct_vox2mean_vox)
>>> mean_in_struct_space = affine_transform(mean_vol, M, T, structural_data.shape, order=1)
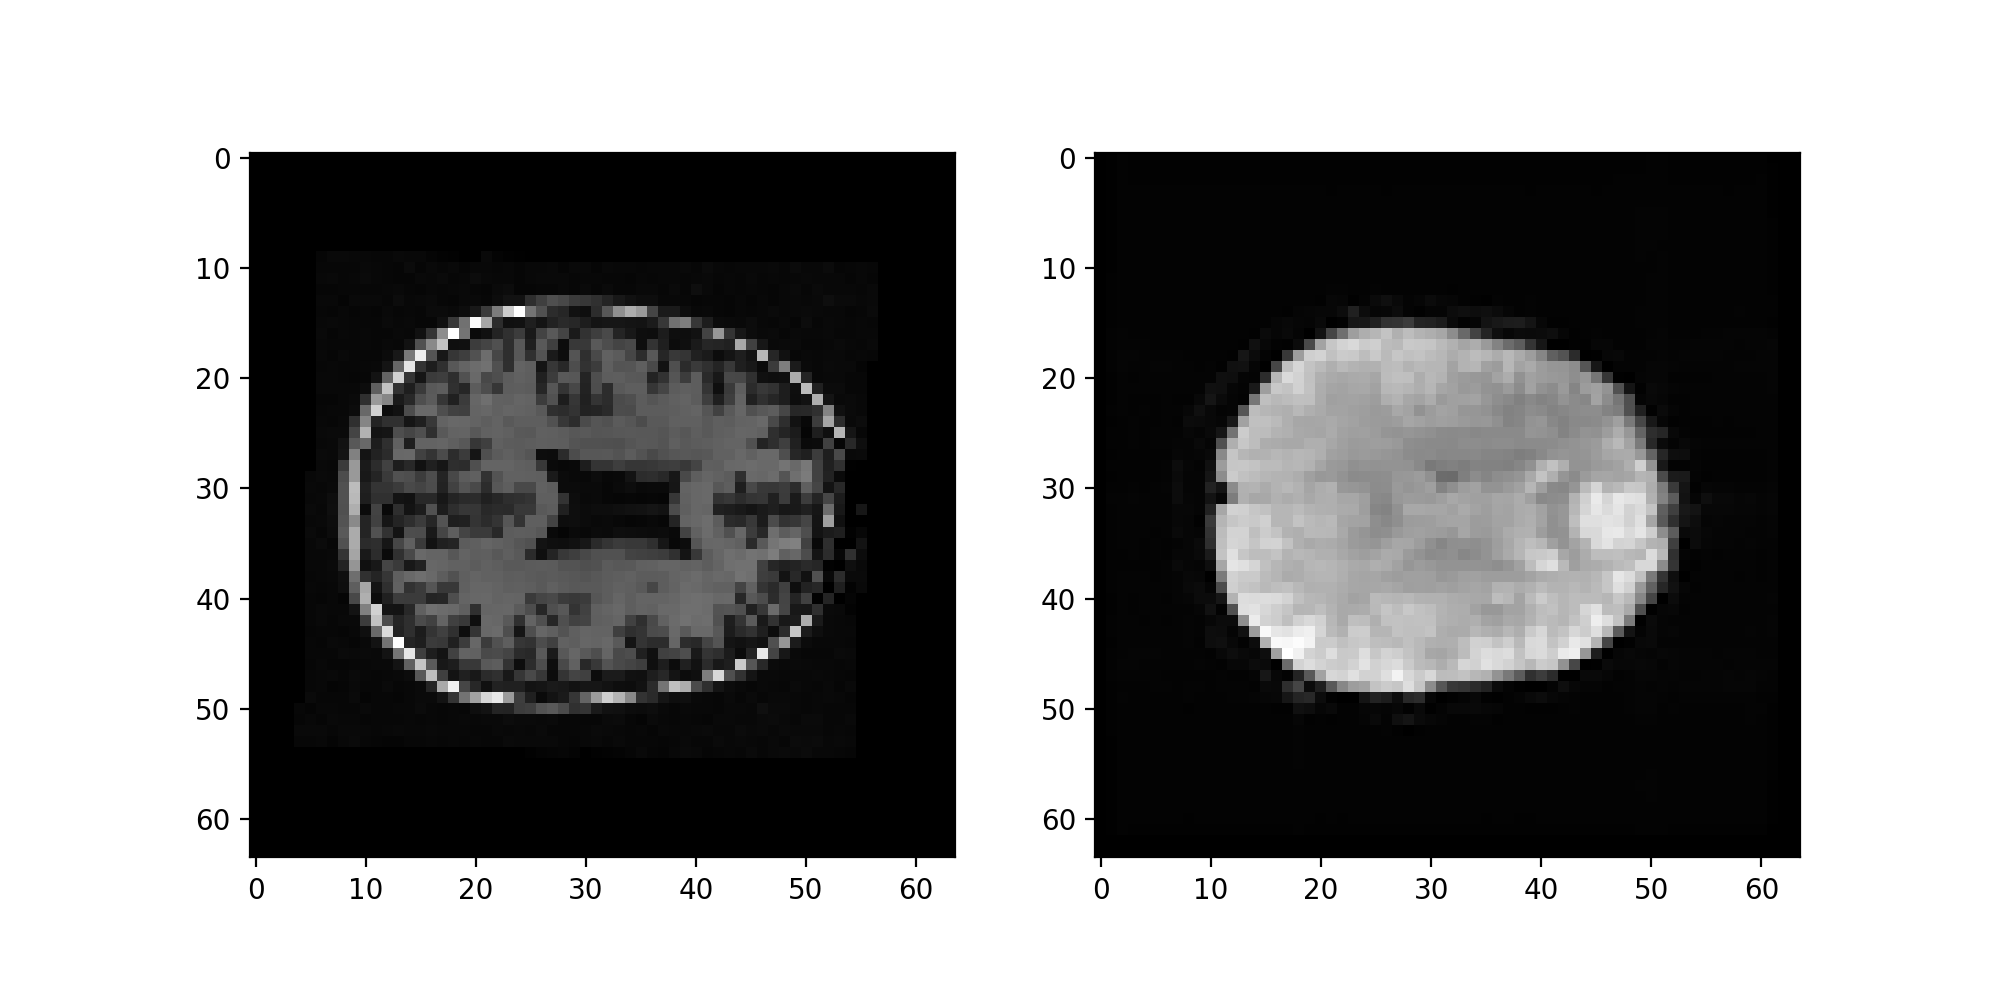
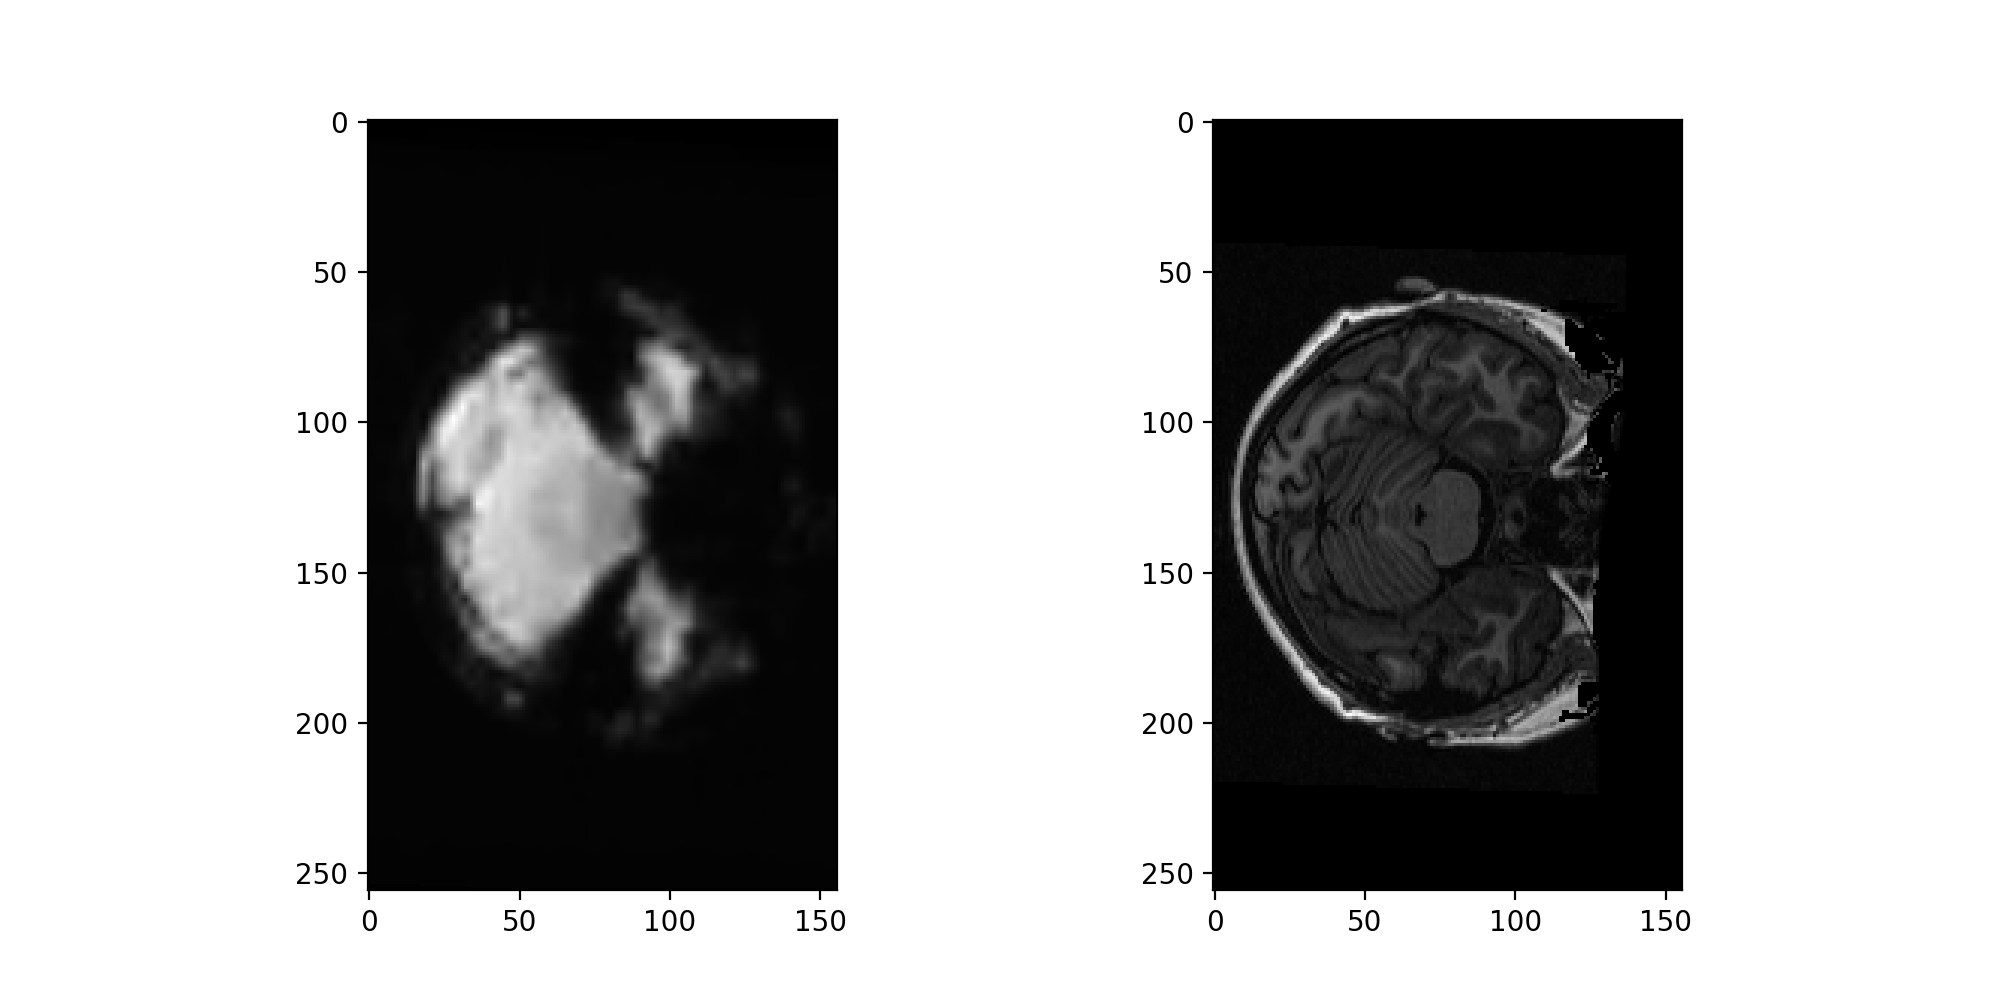
Display example slice for resliced mean functional side by side with structural:
>>> #- Display example slices for resliced mean and structural
>>> fig, axes = plt.subplots(1, 2, figsize=(10, 5))
>>> axes[0].imshow(mean_in_struct_space[:, :, 127])
<...>
>>> axes[1].imshow(structural_data[:, :, 127])
<...>

Can you think of situations where you would prefer to use one direction (e.g. functional to anatomy) over the other?