\(\newcommand{L}[1]{\| #1 \|}\newcommand{VL}[1]{\L{ \vec{#1} }}\newcommand{R}[1]{\operatorname{Re}\,(#1)}\newcommand{I}[1]{\operatorname{Im}\, (#1)}\)
Voxel correlation exercise
>>> #: import common modules
>>> import numpy as np  # the Python array package
>>> import matplotlib.pyplot as plt  # the Python plotting package
>>> import nibabel as nib
Import the events2neural function from the stimuli.py module:
>>> #- import events2neural from stimuli module
>>> from stimuli import events2neural
If you don’t have it already, download the ds114_sub009_t2r1.nii
image. Load it with nibabel.
>>> #- Load the ds114_sub009_t2r1.nii image
>>> img = nib.load('ds114_sub009_t2r1.nii')
>>> #- Get the number of volumes in ds114_sub009_t2r1.nii
>>> n_trs = img.shape[-1]
>>> n_trs
173
The TR (time between scans) is 2.5 seconds.
>>> #: TR
>>> TR = 2.5
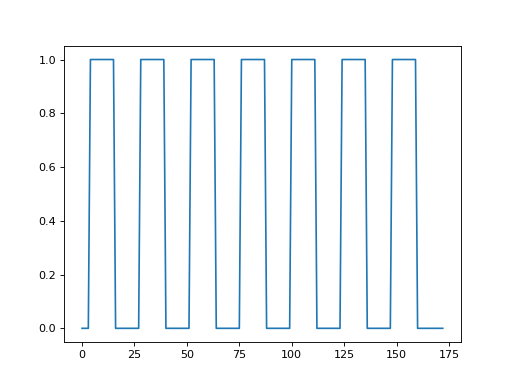
Call the events2neural function to give you a time course that is 1 for
the volumes during the task (thinking of verbs) and 0 for the volumes during
rest.
>>> #- Call the events2neural function to generate the on-off values for
>>> #- each volume.  Plot these values.
>>> time_course = events2neural('ds114_sub009_t2r1_cond.txt', 2.5, n_trs)
>>> plt.plot(time_course)
[...]

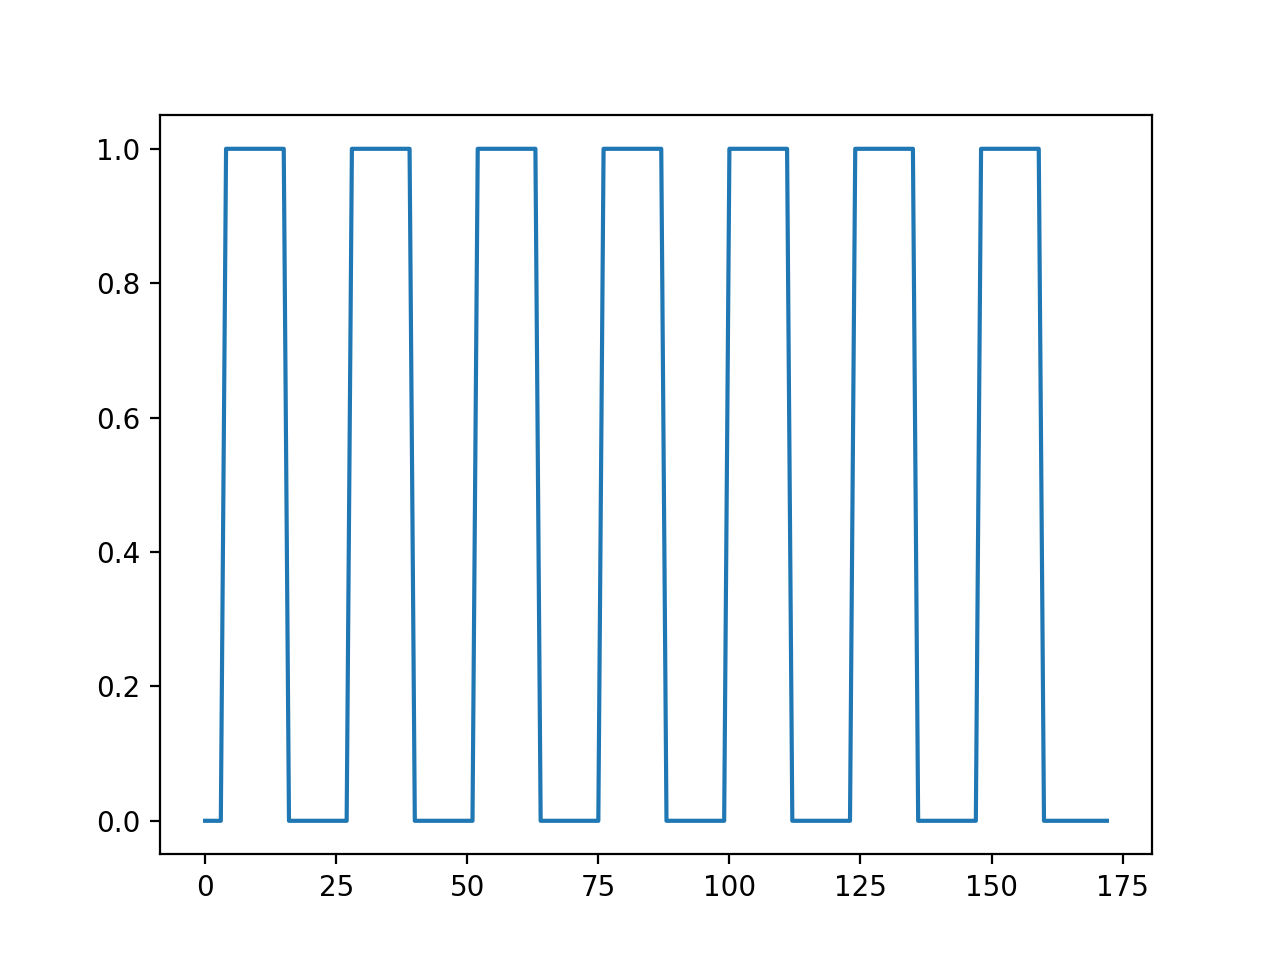
Using slicing, drop the first 4 volumes, and the corresponding on-off values:
>>> #- Drop the first 4 volumes, and the first 4 on-off values.
>>> data = img.get_data()
>>> data = data[..., 4:]
>>> time_course = time_course[4:]
Make a single brain-volume-sized array of all zero to hold the correlations:
>>> #- Make a brain-volume-size array of 0 to hold the correlations
>>> correlations = np.zeros(data.shape[:-1])
- Loop over all voxel indices on the first, then second, then third dimension;
- extract the voxel time courses at each voxel coordinate in the image;
- get the correlation between the voxel time course and neural prediction;
- fill in the value in the correlations array.
>>> #- Loop over all voxel indices.
>>> #- Extract the voxel time courses at each voxel.
>>> #- Get correlation value for voxel time course with on-off vector.
>>> #- Fill value in the correlations array.
>>> for i in range(data.shape[0]):
...     for j in range(data.shape[1]):
...         for k in range(data.shape[2]):
...             vox_values = data[i, j, k]
...             correlations[i, j, k] = np.corrcoef(time_course, vox_values)[1, 0]
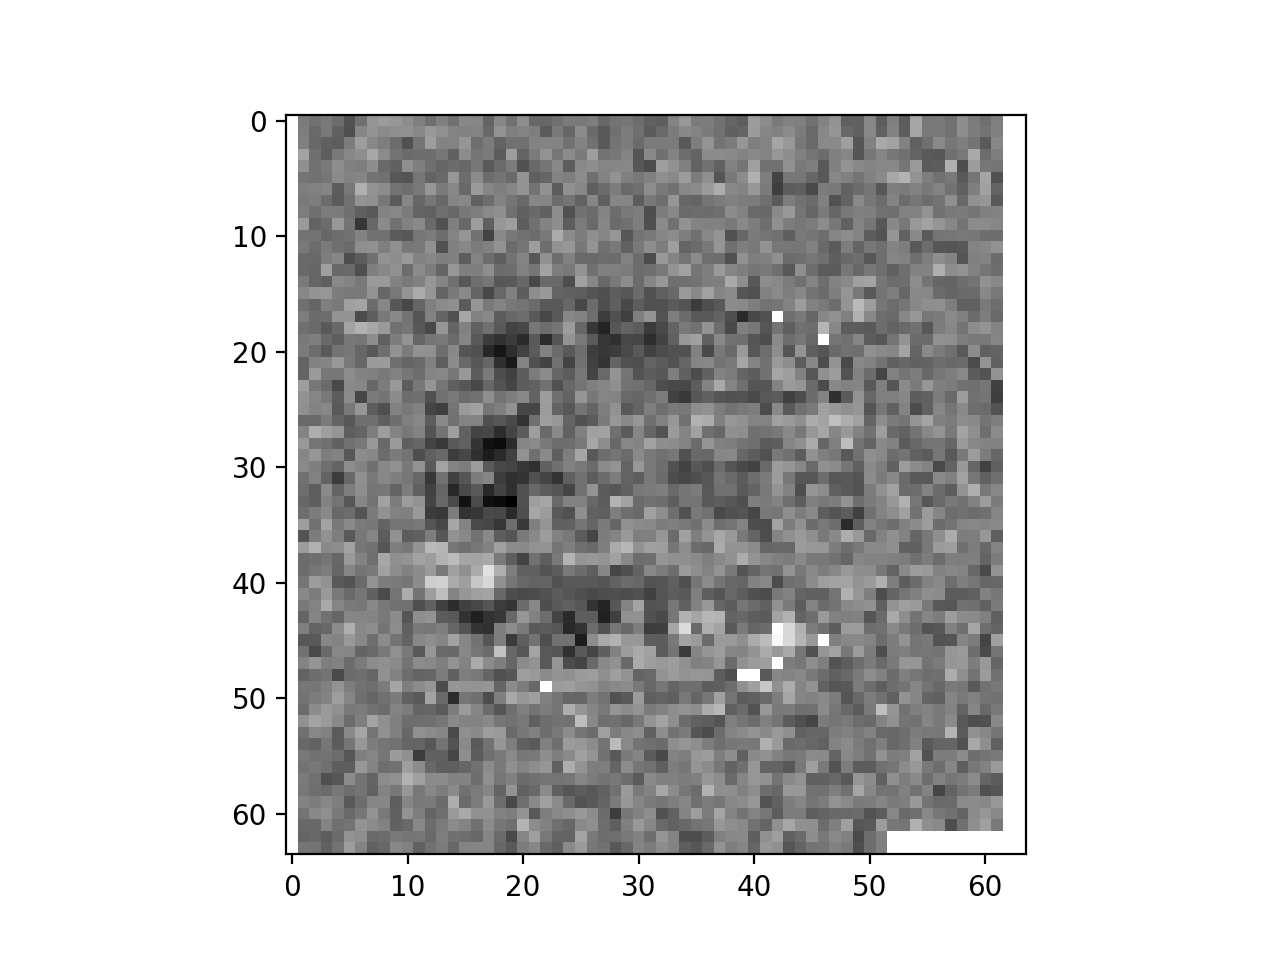
Plot the middle slice (plane) of the third axis from the correlations array. Can you see any sign of activity (high correlation) in the frontal lobe?
>>> #- Plot the middle slice of the third axis from the correlations array
>>> plt.imshow(correlations[:, :, 14], cmap='gray')
<...>
