\(\newcommand{L}[1]{\| #1 \|}\newcommand{VL}[1]{\L{ \vec{#1} }}\newcommand{R}[1]{\operatorname{Re}\,(#1)}\newcommand{I}[1]{\operatorname{Im}\, (#1)}\)
Reshaping 4D images to 2D arrays
See also: Reshaping, 4D to 2D.
>>> #: import common modules
>>> import numpy as np  # the Python array package
>>> import matplotlib.pyplot as plt  # the Python plotting package
>>> # Display array values to 6 digits of precision
>>> np.set_printoptions(precision=4, suppress=True)
In this example, we calculate the standard deviation across voxels at each time point.
We’re working on ds114_sub009_t2r1.nii. This is a 4D FMRI image.
>>> import nibabel as nib
>>> img = nib.load('ds114_sub009_t2r1.nii')
>>> img.shape
(64, 64, 30, 173)
We want to calculate the standard deviation across all voxels. Remember that a voxel is a pixel with volume, and refers to a position in space. Therefore we have this number of voxels in each volume:
>>> n_voxels = np.prod(img.shape[:-1])
>>> n_voxels
122880
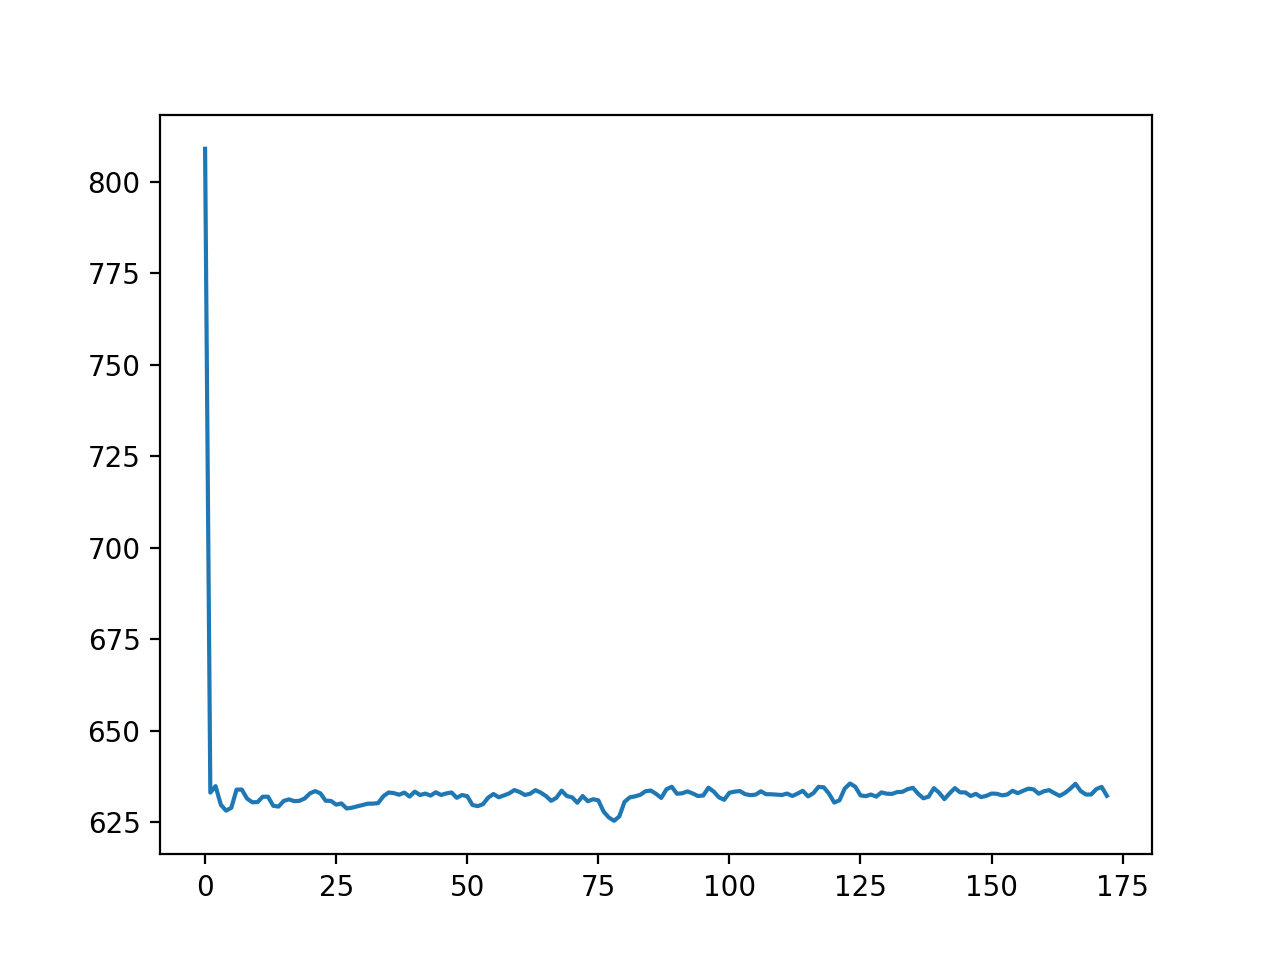
To calculate the standard deviation across voxels, we could loop across all volumes, and calculate the standard deviation for each volume:
>>> n_trs = img.shape[-1]
>>> data = img.get_data()
>>> std_devs = []
>>> for vol_no in range(n_trs):
...     vol = data[..., vol_no]
...     std_devs.append(np.std(vol))
...
>>> plt.plot(std_devs)
[...]
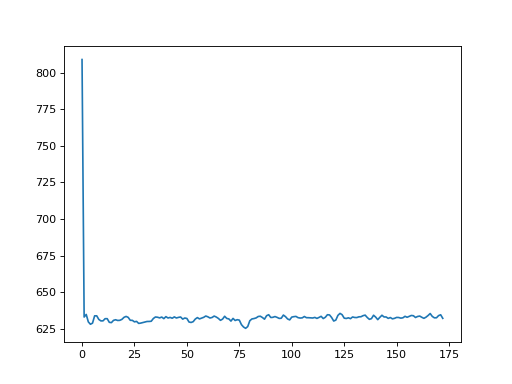
We could also flatten the three voxel axes out into one long voxel axis, using
reshape – see: Reshaping, 4D to 2D. Then we can use the axis
parameter to the np.std function to calculate the standard deviation
across voxels, in one shot. This is “vectorizing”, where we take an operation
that needed a loop, and use array operations to do the work instead:
>>> voxels_by_time = data.reshape((n_voxels, n_trs))
>>> std_devs_vectorized = np.std(voxels_by_time, axis=0)
>>> assert np.allclose(std_devs_vectorized, std_devs)